| 1. | Open the Race Data form |
| 2. | On the Starters View page, click on the [New] button to create a new view |
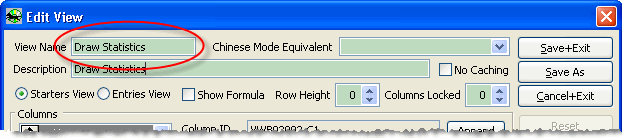
| 3. | Input "Draw Statistics" into the View Name box |
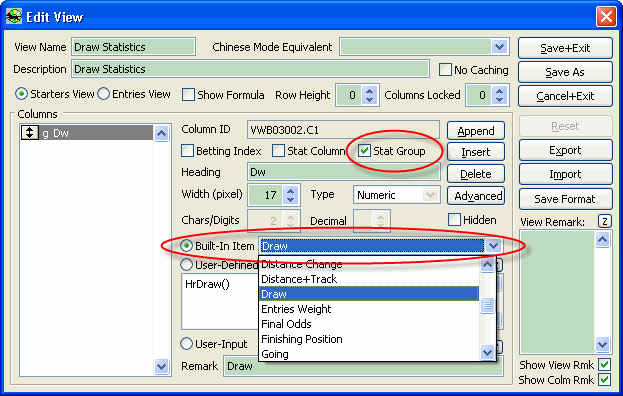
| 4. | Delete the default column 'Horse'. Add a new built-in column 'Draw' into the view and set it as [Stat Group]. |
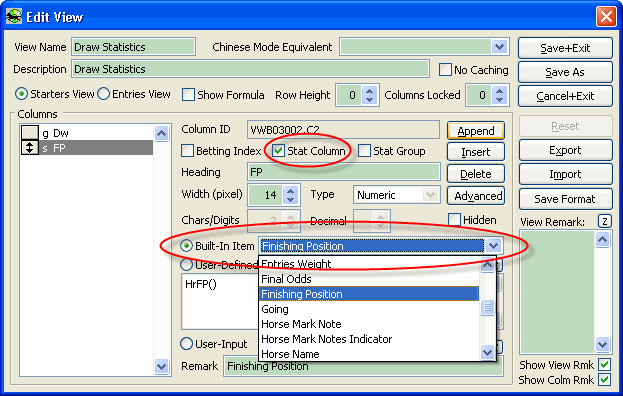
| 5. | Add another new built-in column "Finishing Position" and set it as [Stat Column] |
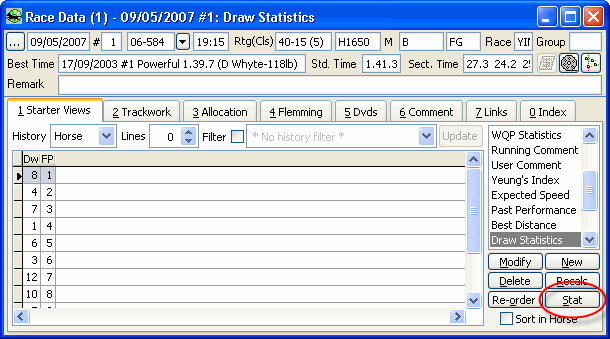
| 6. | Click on the [Save+Exit] button to save and exit the Edit View form. You will see a view page similar to the following screen. |
| 7. | Click on the [Stat] button. |
| 8. | You will see the following Statistical View Calculation form |
| 9. | Set the period to "from the 1st race of season 2005-2006 to the last race (9999) of the season 2005-2006". |
| 10. | Enter the following expression into the Criteria Filter box: |
HrDistance( )<=1600
| 11. | Make sure [Exclude Zeros] is checked |
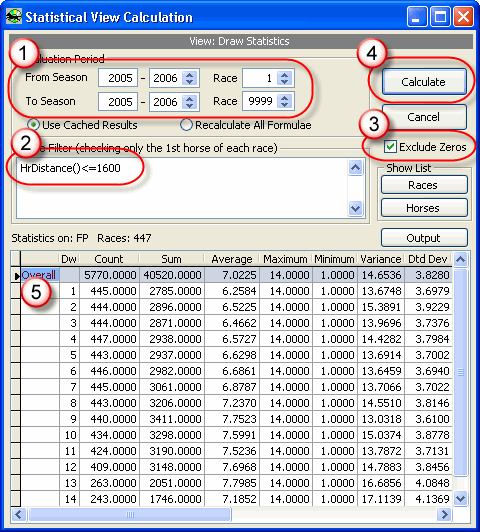
| 12. | Click on the [Calculate] button. You will then see the statistical result shown in the lower part of the form. The result shows that the average finishing position of all draw positions is 7.0225. Position 1 is best draw position, the average finishing position of which is 6.6514. |
Page url:
http://www.racematenet.com/english/help/index.html?basic_steps.htm


